2026 Cap Rate Reality Check
Yields in the Corridor: 2026 Cap Rate Reality Check
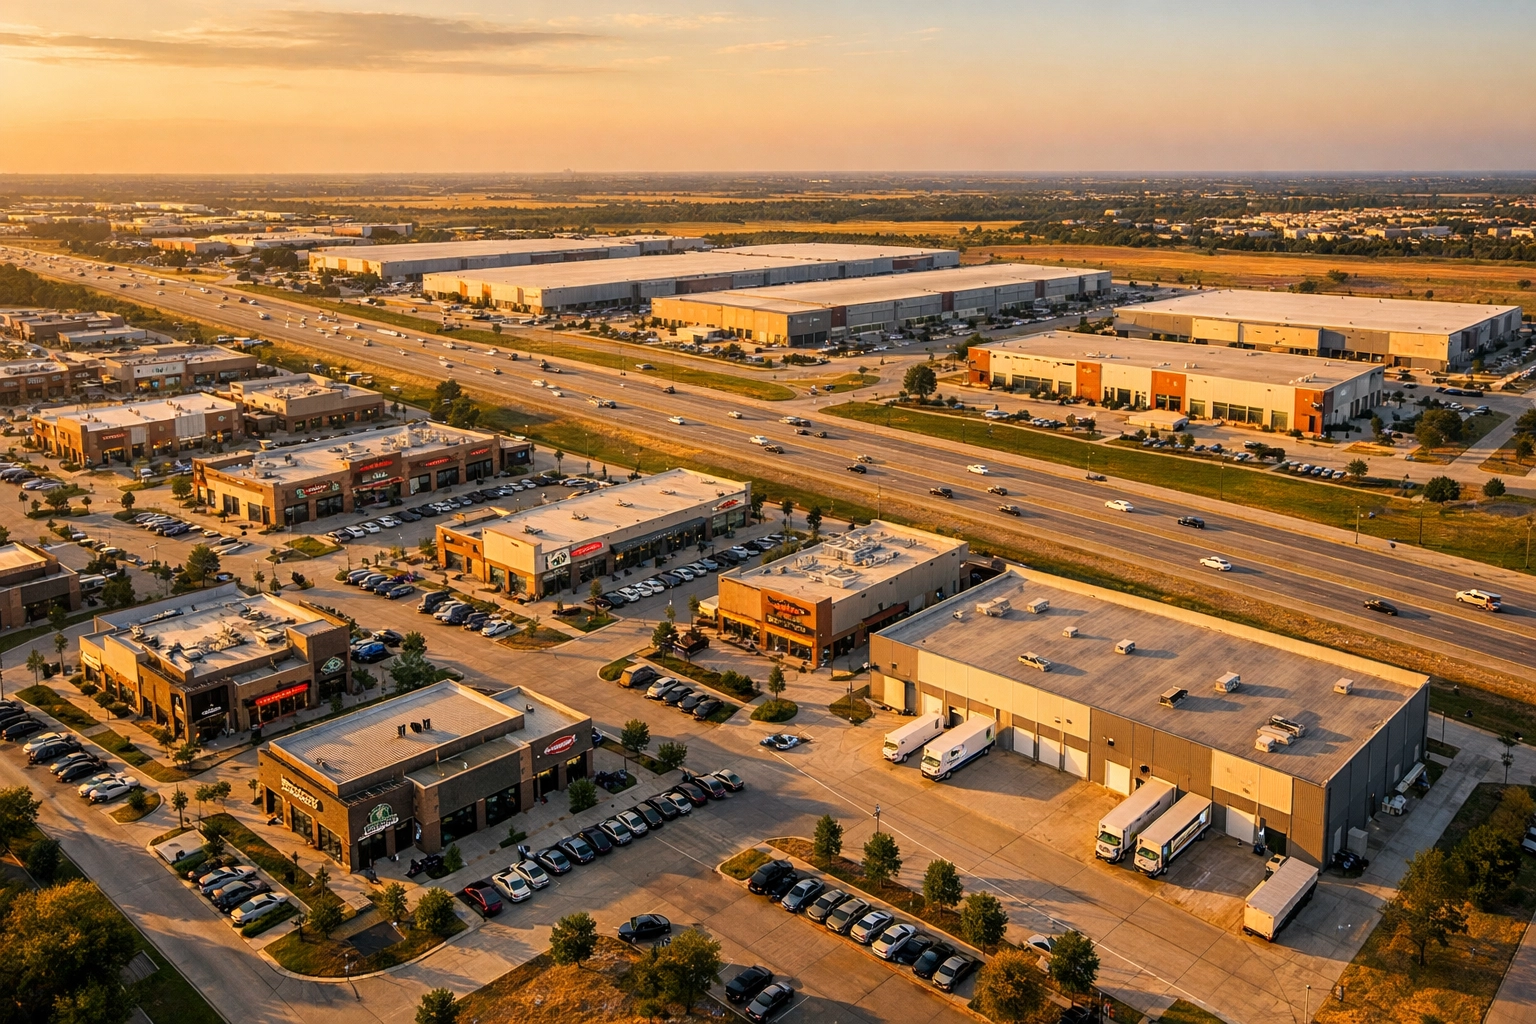
![[HERO] Yields in the Corridor: 2026 Cap Rate Reality Check](https://cdn.marblism.com/8iHGJPwiab-.webp)
If you've been buying commercial real estate in North Texas expecting cap rate compression to carry your returns, 2026 is going to feel different. The 25-year tailwind that took cap rates from roughly 10% in 2000 to the mid-6s today? That's over. And if you're looking at investment opportunities along the Gainesville-to-Frisco corridor, what we call the "Northern Push", you need to recalibrate your underwriting assumptions right now.
This isn't doom and gloom. It's just reality. Cap rates are unlikely to fall materially this year, which means income generation, not valuation appreciation, will drive the majority of your returns going forward. For developers, landlords, and investors working in Celina, Sanger, Gunter, and points north, that shift changes everything about how you evaluate deals.
The End of the Compression Party
Let's get the history out of the way first. For the last two decades, commercial real estate investors have enjoyed one of the most sustained cap rate compression cycles in modern history. When cap rates compress, property values rise, even if your net operating income stays flat. It's been a massive gift to CRE owners, and it created a generation of investors who came to expect multiple expansion as a given.
But when you zoom out to 1953, the data tells a very different story. Long stretches of sideways, choppy, or even rising cap rates are far more common than sustained declines. The 2000–2025 period was the exception, not the rule. And most people working in commercial real estate today have never operated in an environment where cap rates stay flat, or worse, tick upward, for years at a time.
So what does that mean for the Gainesville-to-Frisco corridor in 2026? It means you can't lean on the same underwriting assumptions that worked in 2019 or even 2023. If you're buying a flex building in Sanger or a retail pad in Celina, you need to ask yourself: Can this asset generate enough income to justify the purchase price if cap rates don't move at all?
What Actually Moves Cap Rates (Hint: It's Not Just Interest Rates)
Here's where most people get it wrong. They assume that interest rates and cap rates move in lockstep. Lower rates mean lower cap rates. Higher rates mean higher cap rates. Simple, right?
Wrong.
The stronger historical predictor of cap rate movement isn't the price of debt, it's the quantity of debt. In other words, debt supply matters more than interest rates alone. There have been periods where interest rates and cap rates moved in opposite directions entirely, which throws the conventional wisdom out the window.
For 2026, the good news is that lending conditions are improving. New loan volume increased 13% from late 2024, and commercial mortgage loan spreads have tightened by 183 basis points. That's creating more favorable refinancing opportunities, especially for stabilized assets. But it's not enough to materially compress cap rates, it's just enough to keep the market liquid and functional.
For investors in the Northern Push, this means you're not getting bailed out by cheap money. You're getting rewarded for picking the right asset in the right submarket with the right tenant profile.
Class A vs. Class C: The Yield Spread Is Real
Now let's talk about the spread between Class A and Class C assets, because this is where the rubber meets the road in 2026.
Class A assets: newly constructed retail centers along US-380 in Celina, modern flex/warehouse space in Gunter, or institutional-grade industrial near I-35 in Sanger: are trading in the 5.5% to 6.5% cap rate range right now. These are well-leased, low-maintenance properties with creditworthy tenants and 7–10 years of runway before any significant capital expenditures hit.
Class C assets: older retail strips in secondary nodes, flex space built in the 1990s without modern loading, or industrial buildings with functional obsolescence: are trading closer to 7.5% to 9.0%. The spread is wider than it's been in years, and for good reason. Class C properties require active management, capital investment, and a higher tolerance for tenant turnover.
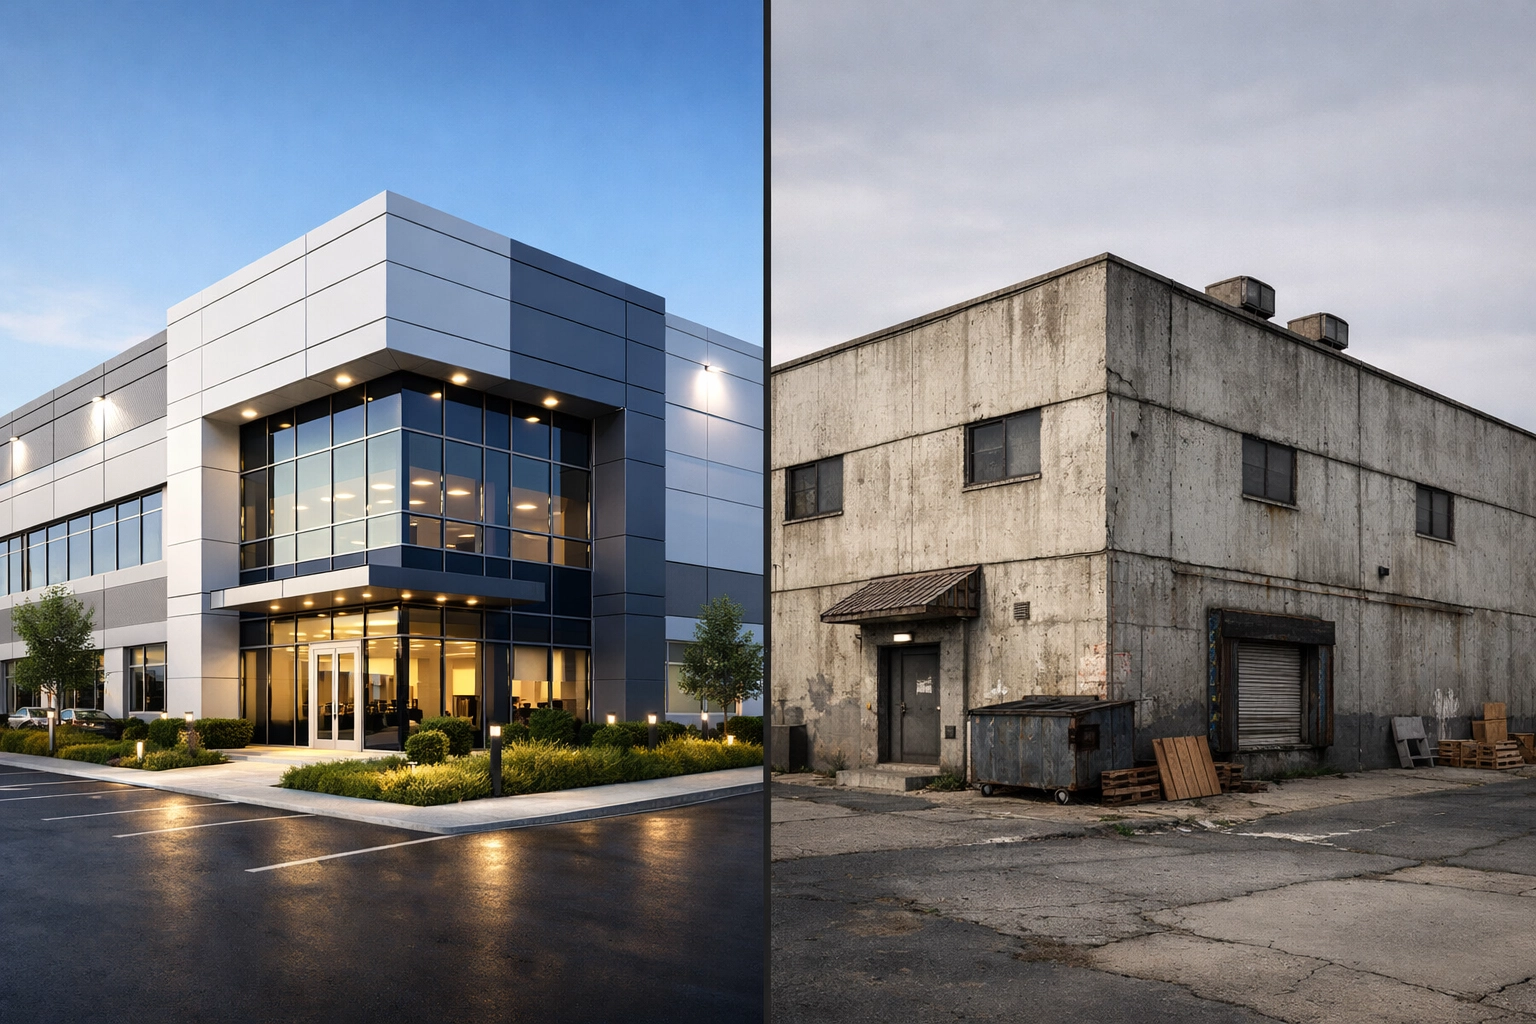
The mistake we see investors making is chasing the higher cap rate without accounting for the hidden costs. A 9% cap rate on a 30-year-old metal building with no dock doors might look attractive on paper, but once you back out deferred maintenance, tenant improvement costs, and vacancy risk, your effective yield could be closer to 6%. Meanwhile, the Class A flex building at a 6% cap rate might actually deliver more cash flow with less hassle.
At Cooper Land Company, we're constantly underwriting deals in this corridor, and the spread tells us something important: the market is pricing in execution risk. If you don't have the bandwidth, capital, or expertise to reposition a Class C asset, you're better off paying up for Class A and sleeping well at night.
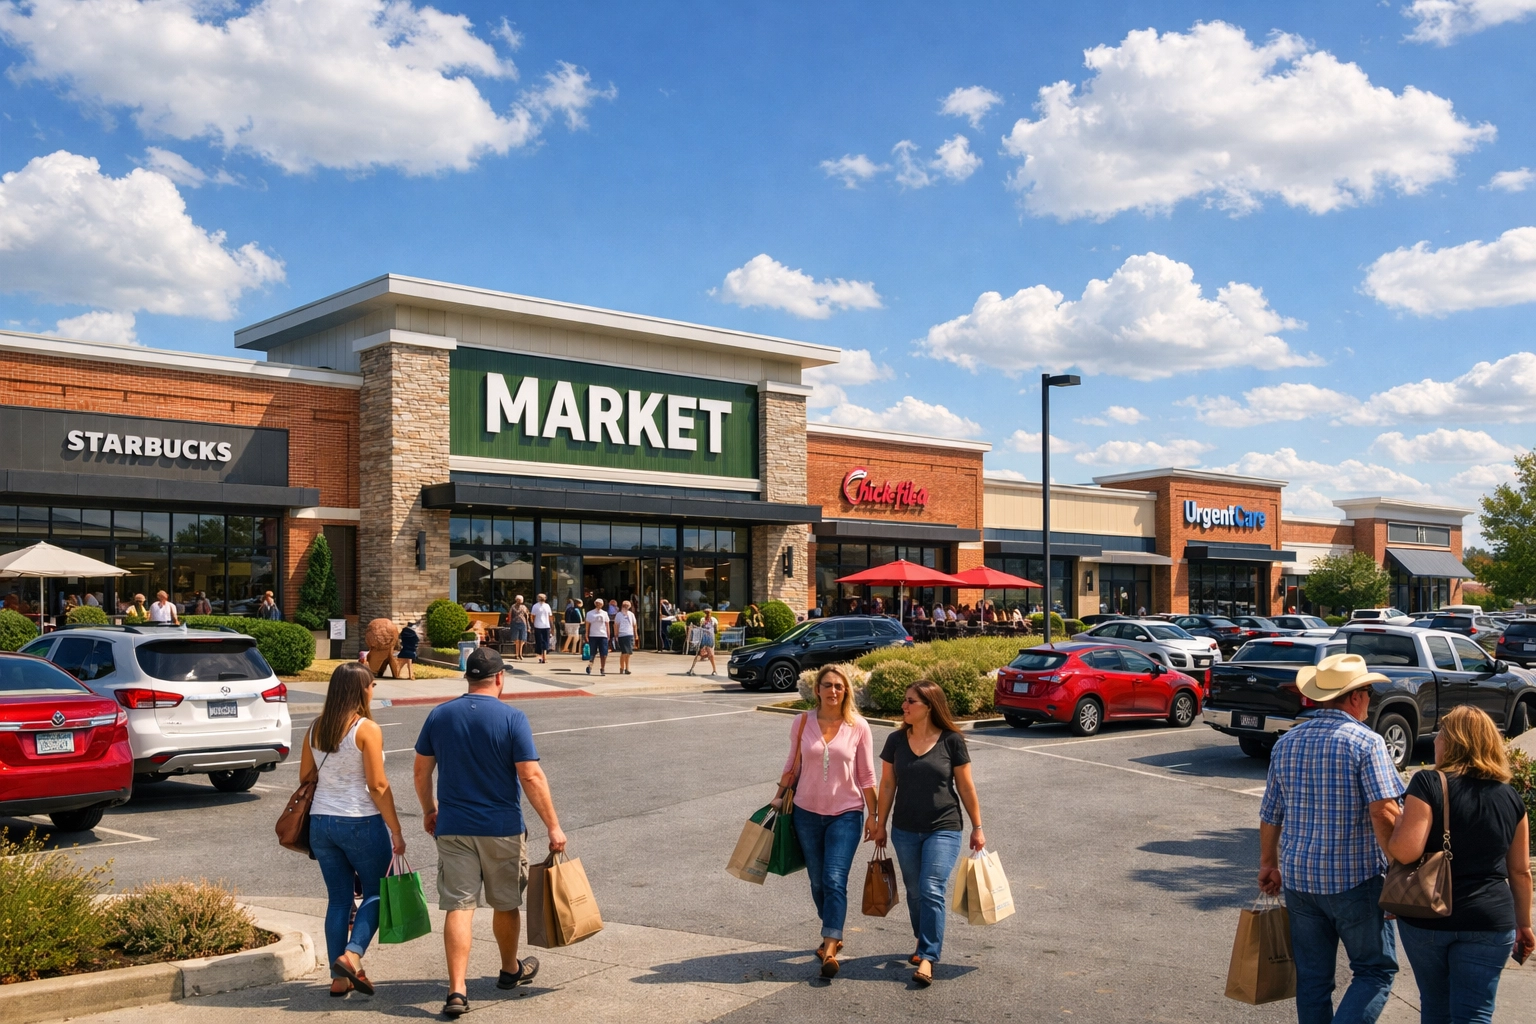
Retail: The Tenant Mix Matters More Than Ever
Retail in the Northern Push is a tale of two markets. Grocery-anchored centers, fast casual restaurants, and medical/service retail are holding firm at 6.0%–6.5% cap rates. These are the properties with long-term leases, consistent traffic, and tenants that can't be replaced by Amazon.
On the flip side, un-anchored strip centers, convenience retail, and anything dependent on discretionary spending are trading at 7.5%–8.5%. The difference isn't just the tenant mix: it's the durability of the income stream. In a flat cap rate environment, you can't afford to own retail that relies on foot traffic from a declining demographic or a fading shopping habit.
Celina is the perfect case study. Retail along US-380 near the Legacy Hills and Light Farms developments is commanding top-of-market pricing because the rooftops are there, the income levels are high, and the tenant demand is real. But a mile south in an older node? You're looking at a completely different risk profile.
Industrial and Flex: The Last-Mile Advantage
Industrial and flex space in the Northern Push is where we're seeing the most interesting dynamics. Last-mile distribution, e-commerce fulfillment, and light industrial are still in high demand, and cap rates are holding in the 5.5%–6.0% range for modern product.
Gainesville, with its I-35 access and proximity to the Oklahoma border, is becoming a legitimate logistics node. Sanger and Pilot Point are following suit. And Celina: despite being known more for residential growth: is starting to see speculative industrial development on its eastern edge.
The key differentiator in 2026 is clear height and modern loading infrastructure. If your building has 28-foot clear height, cross-dock configuration, and trailer parking, you're in the 5.5%–6.0% range. If it's a 1990s-era tilt-wall with 18-foot clear height and no dock doors, you're closer to 8.0%. The spread is that wide, and it reflects the operational efficiency gap between old and new product.
Flex space: particularly 10,000–30,000 square foot units that blend office and warehouse: is trading at 6.5%–7.5% depending on location and configuration. This asset class is popular with small contractors, fabricators, and service businesses that need both storage and office presence. It's not institutional-grade, but it's steady, and in a flat cap rate environment, steady wins.
What Investors Should Expect in 2026
So what's the bottom line for yields in the corridor this year? Here's what we're telling clients:
1. Don't underwrite cap rate compression. If your pro forma assumes you'll exit at a 5.0% cap rate because "that's where the market is headed," you're setting yourself up for disappointment. Assume you'll exit at the same cap rate you buy: or higher.
2. Focus on income growth, not valuation appreciation. Can you raise rents? Can you improve occupancy? Can you reduce operating expenses? Those are the levers that will drive returns in 2026, not multiple expansion.
3. Quality matters more than ever. The spread between Class A and Class C is real, and it's widening. If you're going to buy Class C, make sure you have a clear value-add plan and the capital to execute it.
4. Tenant credit and lease duration are king. A 10-year lease with a creditworthy tenant is worth paying up for. A month-to-month tenant in a commodity space is not.
5. Location within the corridor still matters. Celina and Prosper are not the same as Gunter and Whitesboro. Proximity to US-380, SH-121, and I-35 drives rent growth and tenant demand. Don't confuse "Northern Push" with "anywhere north of McKinney."
The Cooper Land Company Advantage
We've been working in the Northern Push since before it had a name. We've seen the cap rate compression cycle, and we're watching the transition to an income-driven market in real time. Our clients are developers, institutional investors, and private equity groups who need to know what assets are actually worth: not what a broker's market pitch says they're worth.
If you're looking at acquisitions or dispositions in the Gainesville-to-Frisco corridor, we're happy to walk through current cap rate comps, rent growth assumptions, and realistic exit scenarios. The market has changed, and the underwriting needs to change with it.
You can reach our team at Cooper Land Company to discuss how 2026 cap rate dynamics are affecting your investment strategy in North Texas.
Dan Cooper
Owner/Broker
Cooper Land Company
OUR LISTINGS
© 2026 Cooper Land Company
DMCA Notice | Terms & Services | Privacy Policy | Accessibility Statement
EQUAL HOUSING OPPORTUNITY


Cooper Land Company
2501 Greenspoint Ln, Prosper, TX 75078
Mobile: 214-714-5638
dan@cooperlandcompany.com